Call details
Click a row to open the call’s own page.Cache lineage
It displays the calls behind the cache entry this call read: the call that wrote the cache entry, the calls that read it since, and this call last. PS: Some providers’ caching have their Time-To-Live (TTL) refreshed on every hit. In this case the penultimate call is labeled Cache last refreshed by.Prompt
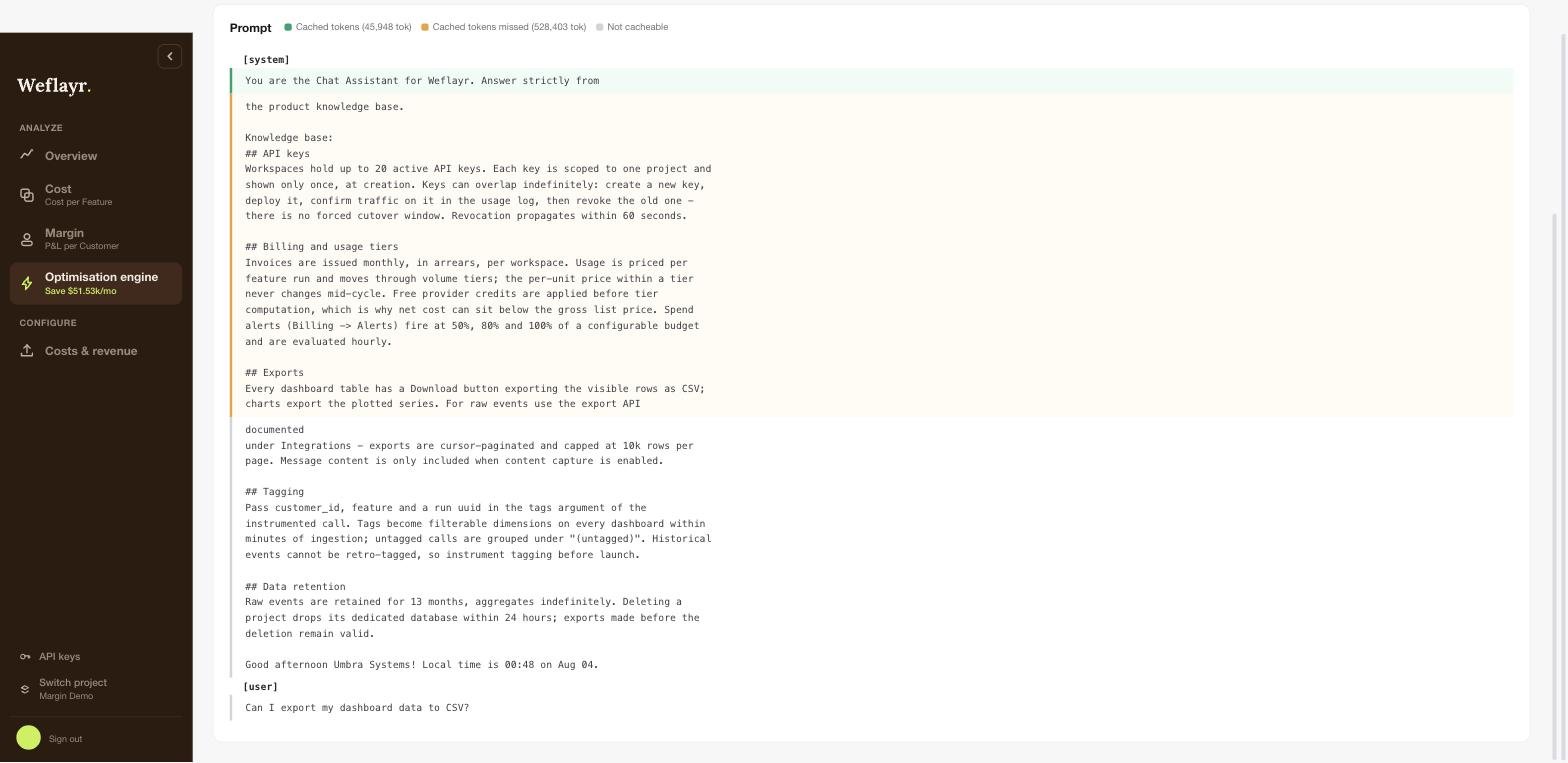
Visualize which parts of the prompt have been correctly cached and which have been missed.